

For private market investors, data maturity is often framed as a clear path: from scattered spreadsheets to strategic dashboards. But that framing oversimplifies both the challenge and the opportunity.
In practice, data maturity isn’t linear. It rarely moves at the same pace across a firm, let alone across a portfolio. It’s influenced by sector, ownership structure, resource constraints, leadership turnover, and critically, what the organization actually values.
The challenge is not just collecting more data. It’s progressing toward smarter use of that data, in ways that align with investment strategy and operating context.
A Working Model for Data Maturity
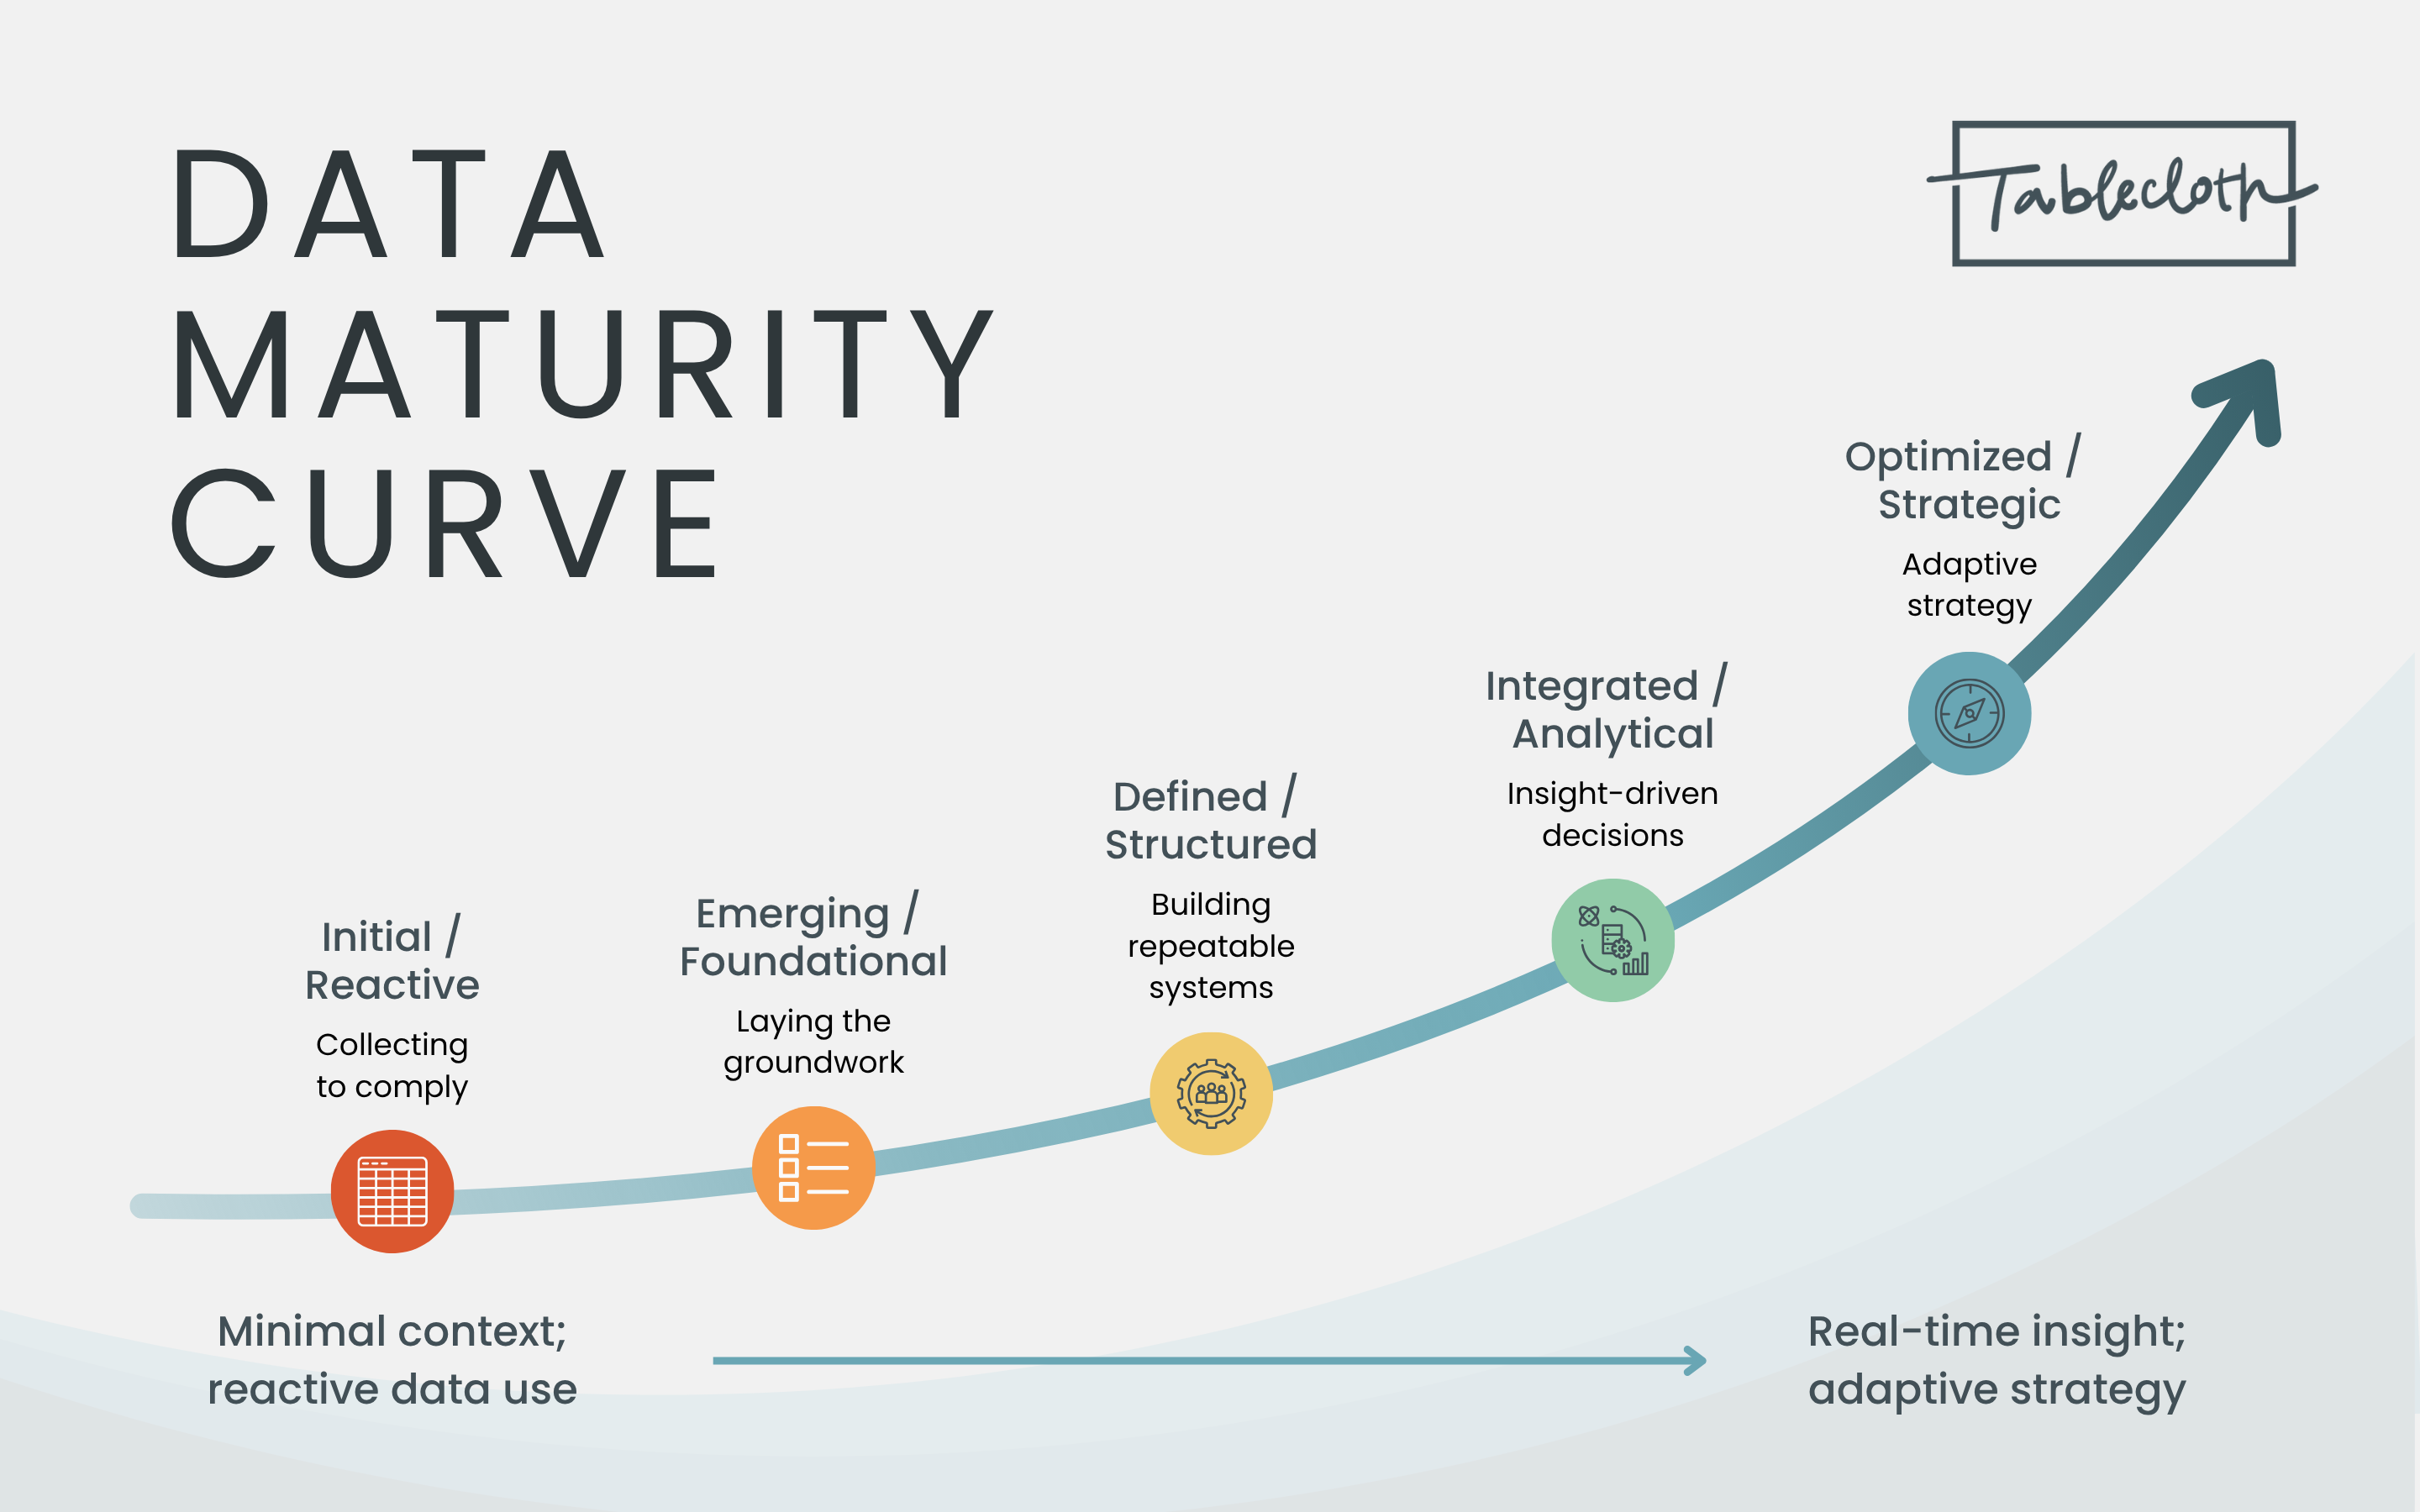
A useful way to understand this evolution is through a maturity curve. While the language may vary across firms, a practical model reflects five stages:
- Initial / Reactive: Data is minimal and fragmented, often pulled together under deadline. The goal is avoidance—of regulatory risk, LP dissatisfaction, or reputational exposure.
- Emerging / Foundational: A shift begins. Common metrics are named (e.g., DEI, energy use, safety), and data collection becomes more intentional. Still, tools are basic, and consistency is limited.
- Defined / Structured: Data systems mature. Internal controls improve. Metrics are collected on a repeatable schedule and mapped to frameworks like SASB or GRI. This is where comparability becomes possible.
- Integrated / Analytical: Non-financial metrics are linked to business KPIs. Data feeds into scenario models, dashboards, or underwriting processes. Strategic decision-makers begin to rely on it.
- Optimized / Strategic: Data becomes an asset. It supports real-time insights, external transparency, and performance-based incentives. Material factors inform value creation, not just risk mitigation.
Each subsequent stage introduces more consistency, integration, and insight.
The Value (and Limits) of Data
There’s no doubt that more mature systems can offer tangible benefits. Structured data enables comparability. Integrated data sharpens risk models. When non-financial metrics are linked to investment theses or operational KPIs, it becomes easier to spot patterns, surface blind spots, and justify strategic pivots.
But maturity isn't just about infrastructure. It’s about the ability to act. Data, no matter how timely, validated, or well-visualized, has limited value if the organization isn’t positioned to use it. We've seen firms invest in platforms and processes only to find that key stakeholders lack the mandate, capacity, or incentive to respond to what the data reveals.
This is where many maturity efforts stall: not at the point of collection, but at the point of decision. Teams may trust the data and understand its implications, but still face barriers like internal politics, misaligned incentives, and rigid hierarchies that prevent action. Insight without authority is inertia.
Fostering buy-in often starts with reframing data work as decision support, not compliance. That means co-creating metrics with operators, tying indicators to real operational and financial decisions, and giving authority to the people closest to the outcomes. In some cases, it also means aligning incentives—embedding data-informed action into performance reviews, compensation structures, or capital planning.
Progress in data maturity isn’t just about better systems. It’s about enabling decisions, clarifying accountability, and shifting perspectives. The key question isn’t “Do we have the data?” It’s: “Are we ready and equipped to act on it?”
What Progress Looks Like (and What It Doesn’t)
Not every advance looks like a new dashboard. Sometimes it’s a CFO rethinking which workforce metrics belong in board reports. A junior associate building an emissions tracker in Excel because there's no software budget yet. A portfolio company pushing back on a data request—and offering a more relevant indicator instead.
Other times, progress isn’t visible in systems but in conversations. A shift from “Why do we need to report this?” to “What could this tell us?” signals something important: curiosity replacing defensiveness.
And sometimes, progress stalls. Leadership turnover, budget cuts, or shifting LP expectations can slow or reverse maturity efforts. The curve doesn’t show that, but everyone who’s lived it knows: this work isn’t a straight line.
Start with Where You Are
Maturity does not require optimizing every single data point. In fact, trying to standardize and refine every data category at once often backfires—creating noise instead of clarity, and effort without insight.
The most effective efforts focus where the stakes are highest. In labor-intensive businesses, that might mean deepening the quality of workforce and retention data. In resource-constrained sectors, it could mean real-time metrics tied to water or energy intensity.
In each case, the path forward starts with asking: What do we need to understand better in order to make a different or better decision? And how do we ensure the people closest to that decision are empowered to act?
Where to Begin (or Continue)
Whether you’re organizing your first survey responses or refining portfolio-level analytics, the next step begins with clarity about your current state.
Use our Data Maturity Curve to:
- Benchmark your baseline
- Build a roadmap for improvement
- Communicate progress to boards, LPs, and operating teams
It’s not about perfection. It’s about momentum—and making sure the systems you build lead to decisions you’re ready and able to make.


